![]()


- HOME>
- Business Results Highlights [Consolidated Business Highlights]

| 2009 | 2010 | 2011 | 2012 | 2012 | |
|---|---|---|---|---|---|
| Net sales | ¥ 429,195 | ¥ 384,679 | ¥ 396,732 | ¥ 395,502 | $ 4,815,571 |
| Gross profit | 119,092 | 138,867 | 166,055 | 161,663 | 1,968,386 |
| Selling, general and administrative (SG&A) expenses |
110,728 | 102,154 | 97,304 | 103,279 | 1,257,511 |
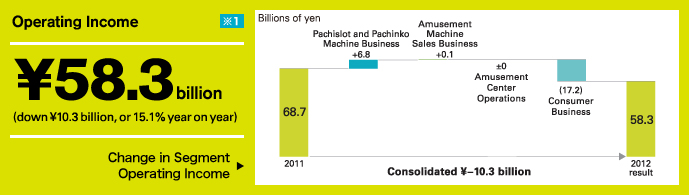
| Operating income (loss) | 8,363 | 36,712 | 68,750 | ∗1 58,384 | 710,874 |
| EBITDA2 | 35,007 | 53,887 | 84,699 | 74,542 | 907,615 |
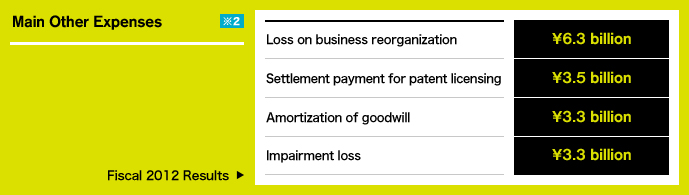
| Net income (loss) | (22,882) | 20,269 | 41,510 | ∗2 21,820 | 265,677 |
| Capital expenditures | 26,610 | 16,164 | 19,686 | 36,141 | 440,051 |
| Depreciation and amortization | 26,644 | 17,175 | 15,949 | 16,158 | 196,741 |
| R&D expenses, content production expenses |
59,676 | 41,502 | 41,104 | 53,348 | 649,555 |
| Net cash provided by (used in) operating activities |
32,199 | 54,998 | 87,696 | 38,023 | 462,970 |
| Net cash provided by (used in) content production expenses |
936 | (7,640) | (29,585) | (59,012) | (718,529) |
| Net cash provided by (used in) financing activities |
(7,653) | (3,401) | (57,168) | 914 | 11,130 |
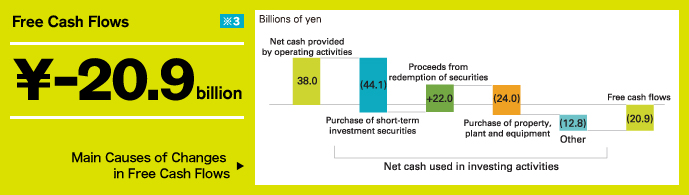
| Free cash flows3 | 33,135 | 47,358 | 58,111 | ∗3 (20,989) | (255,558) |
| Total assets | 423,938 | 423,161 | 458,624 | 497,451 | 6,056,877 |
| Total net assets / shareholders' equity4 | 242,532 | 256,770 | 285,461 | 296,376 | 3,608,621 |
| Number of shares outstanding (shares) |
283,229,476 | 283,229,476 | 266,229,476 | 266,229,476 | 266,229,476 |

| Per Share Data | 2009 | 2010 | 2011 | 2012 | 2012 |
|---|---|---|---|---|---|
| Net income (loss) | ¥ (90.83) | ¥ 80.46 | ¥ 163.19 | ¥ 86.73 | $ 1.05 |
| Diluted net income | 163.01 | 86.54 | 1.05 | ||
| Total net assets / shareholders' equity4 | 882.47 | 937.80 | 1,093.23 | 1,167.59 | 14.21 |
| Cash dividends | 30.00 | 30.00 | 40.00 | 40.00 | 0.48 |

| Key Ratios | 2009 | 2010 | 2011 | 2012 | |
|---|---|---|---|---|---|
| Gross profit margin | 27.7 | 36.1 | 41.9 | 40.9 | |
| SG&A ratio | 25.8 | 26.6 | 24.5 | 26.1 | |
| Operating margin | 1.9 | 9.5 | 17.3 | 14.8 | |
| R&D expenses to net sales | 13.9 | 10.8 | 10.4 | 13.5 | |
| ROE | 8.8 | 16.2 | 7.7 | ||
| ROA5 | 1.5 | 8.5 | 15.5 | 12.2 | |
| Total net assets ratio | 52.4 | 55.8 | 60.0 | 58.9 |
1 Yen amounts have been translated into U.S. dollars solely for convenience at the rate of ¥82.13 to U.S.$1, the prevailing exchange
rate at March 31, 2012.
2 EBITDA = Operating income (loss) + Depreciation and amortization
3 Free cash flows = Net cash provided by (used in) operating activities + Net cash provided by (used in) investing activities
4 Following the enactment of the new Companies Act of Japan in 2006, the Company presents total net assets for the fiscal year ended
March 31, 2007and subsequent fiscal years,which represent the shareholders' equity figure used in previous years plus minority interests
and share subscription rights.
5 ROA = Ordinary income ÷ Total assets