

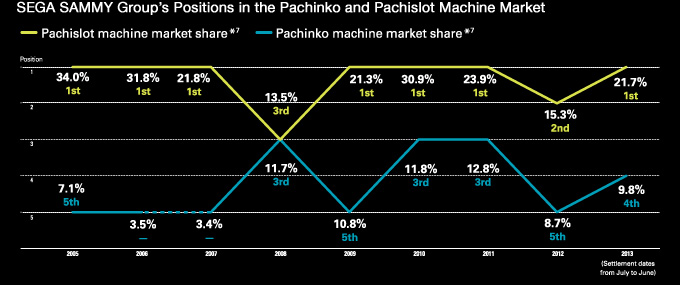
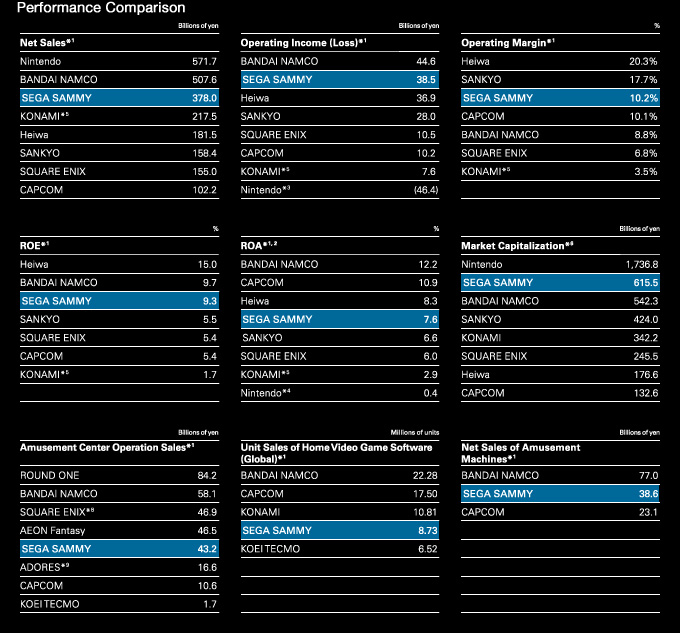
Note: The above is intended to give an idea of the Group's position in the industry and only covers companies for which information can be obtained from published documents, such as listed companies. Because there are unlisted companies that do not disclose information, this is not a completely accurate industry ranking.
- *1 Respective companies' most recent settlement data. Source: Respective companies' published documents
- *2 ROA = Ordinary income ÷ Total assets
- *3 Operating margin has not been included because an operating loss was recognized for fiscal 2014.
- *4 ROE has not been included because an ordinary loss was recognized for fiscal 2014.
- *5 U.S. GAAP. ROE = Net income ÷ Shareholders equity; ROA = Income before income taxes and equity in net income of affiliated company ÷ Total assets
- *6 Source: Calculated by the Company based on the closing prices at respective stock exchanges on March 31, 2014.
- *7 Source: Yano Research Institute Ltd. In accordance with a request from the research organization, company names other than those of Group companies have been indicated using initials.
- *8 "Amusement" including amusement centers and amusement arcade machines
- *9 Amusement Center Operations