Stock Information
Information on Outstanding Shares
Basic Stock Information
(As of March 31, 2026)
| Company name | SEGA SAMMY HOLDINGS INC. | |
| Established | 1-Oct-04 | |
| Stock Code | 6460 | |
| Capital | 29,900 million yen | |
| Stock Exchange | Tokyo Stock Exchange | |
| the details of the shares it issues | Common Stock | |
| Number of shares authorized for issue |
800,000,000 | |
| Total shares issued and outstanding |
221,229,476 | |
| Round Lot | 100 shares | |
| Number of Shareholders | 55,827 | |
| Fiscal Year-End | March 31 | |
| Ordinary General Meeting of Shareholders |
June | |
| Record Date | Ordinary General Meeting of Shareholders | March 31 |
| Record for Dividends | ||
| (fiscal year) | March 31 | |
| (Interim) | September 30 | |
| Advance public notice is given when required for other dividend payments. | ||
| Administrative Office of Transfer Agent |
Mitsubishi UFJ Trust and Banking Corporation branches in Japan | |
| Securities Agent Department, Mitsubishi UFJ Trust and Banking Corporation 7-10-11, Higashisuna, Koto-ku, Toyko 137-8081, Japan Phone: +81-3-5683-5111 | ||
| Agency | Mitsubishi UFJ Trust and Banking Corporation branches in Japan The website of Mitsubishi UFJ Trust and Banking Corporation, the Company’s transfer agent, provides information on share registration, purchase or additional purchase of shares in fractional lots, and other stock-related procedures. If using the storage transfer system for share certificates, etc., please contact the securities company that handles the transaction. Mitsubishi UFJ Trust and Banking Corporation website: http://www.tr.mufg.jp/daikou/ |
|
| Special Benefit Plan for Shareholders | We are not implemented shareholder benefits program. | |
| Articles of Incorporation/ Share Handling Regulations |
Articles of Incorporation(PDF : 235KB) Share Handling Regulations (JAPANESE)(PDF : 58KB) |
|
Composition of Major Shareholders
(As of March 31, 2026)
| Name of shareholder | No. of shares held (thousand share(s)) |
Shareholding ratio (%) |
|---|---|---|
| HS Company | 41,168 | 18.60 |
| The Master Trust Bank of Japan, Ltd. (Trust account) | 23,626 | 10.67 |
| STATE STREET BANK AND TRUST COMPANY 505001 | 14,681 | 6.63 |
| FSC Co. | 13,682 | 6.18 |
| Custody Bank of Japan, Ltd.(Trust account) | 9,469 | 4.28 |
| SEGA SAMMY HOLDINGS INC. | 16,585 | 7.49 |
| THE BANK OF NEW YORK MELLON 140044 | 3,093 | 1.39 | Hajime Satomi | 4,178 | 1.88 |
| STATE STREET BANK AND TRUST COMPANY 505103 | 3,716 | 1.67 |
| Haruki Satomi | 3,921 | 1.77 |
Distribution by Attribute
2026/3/31
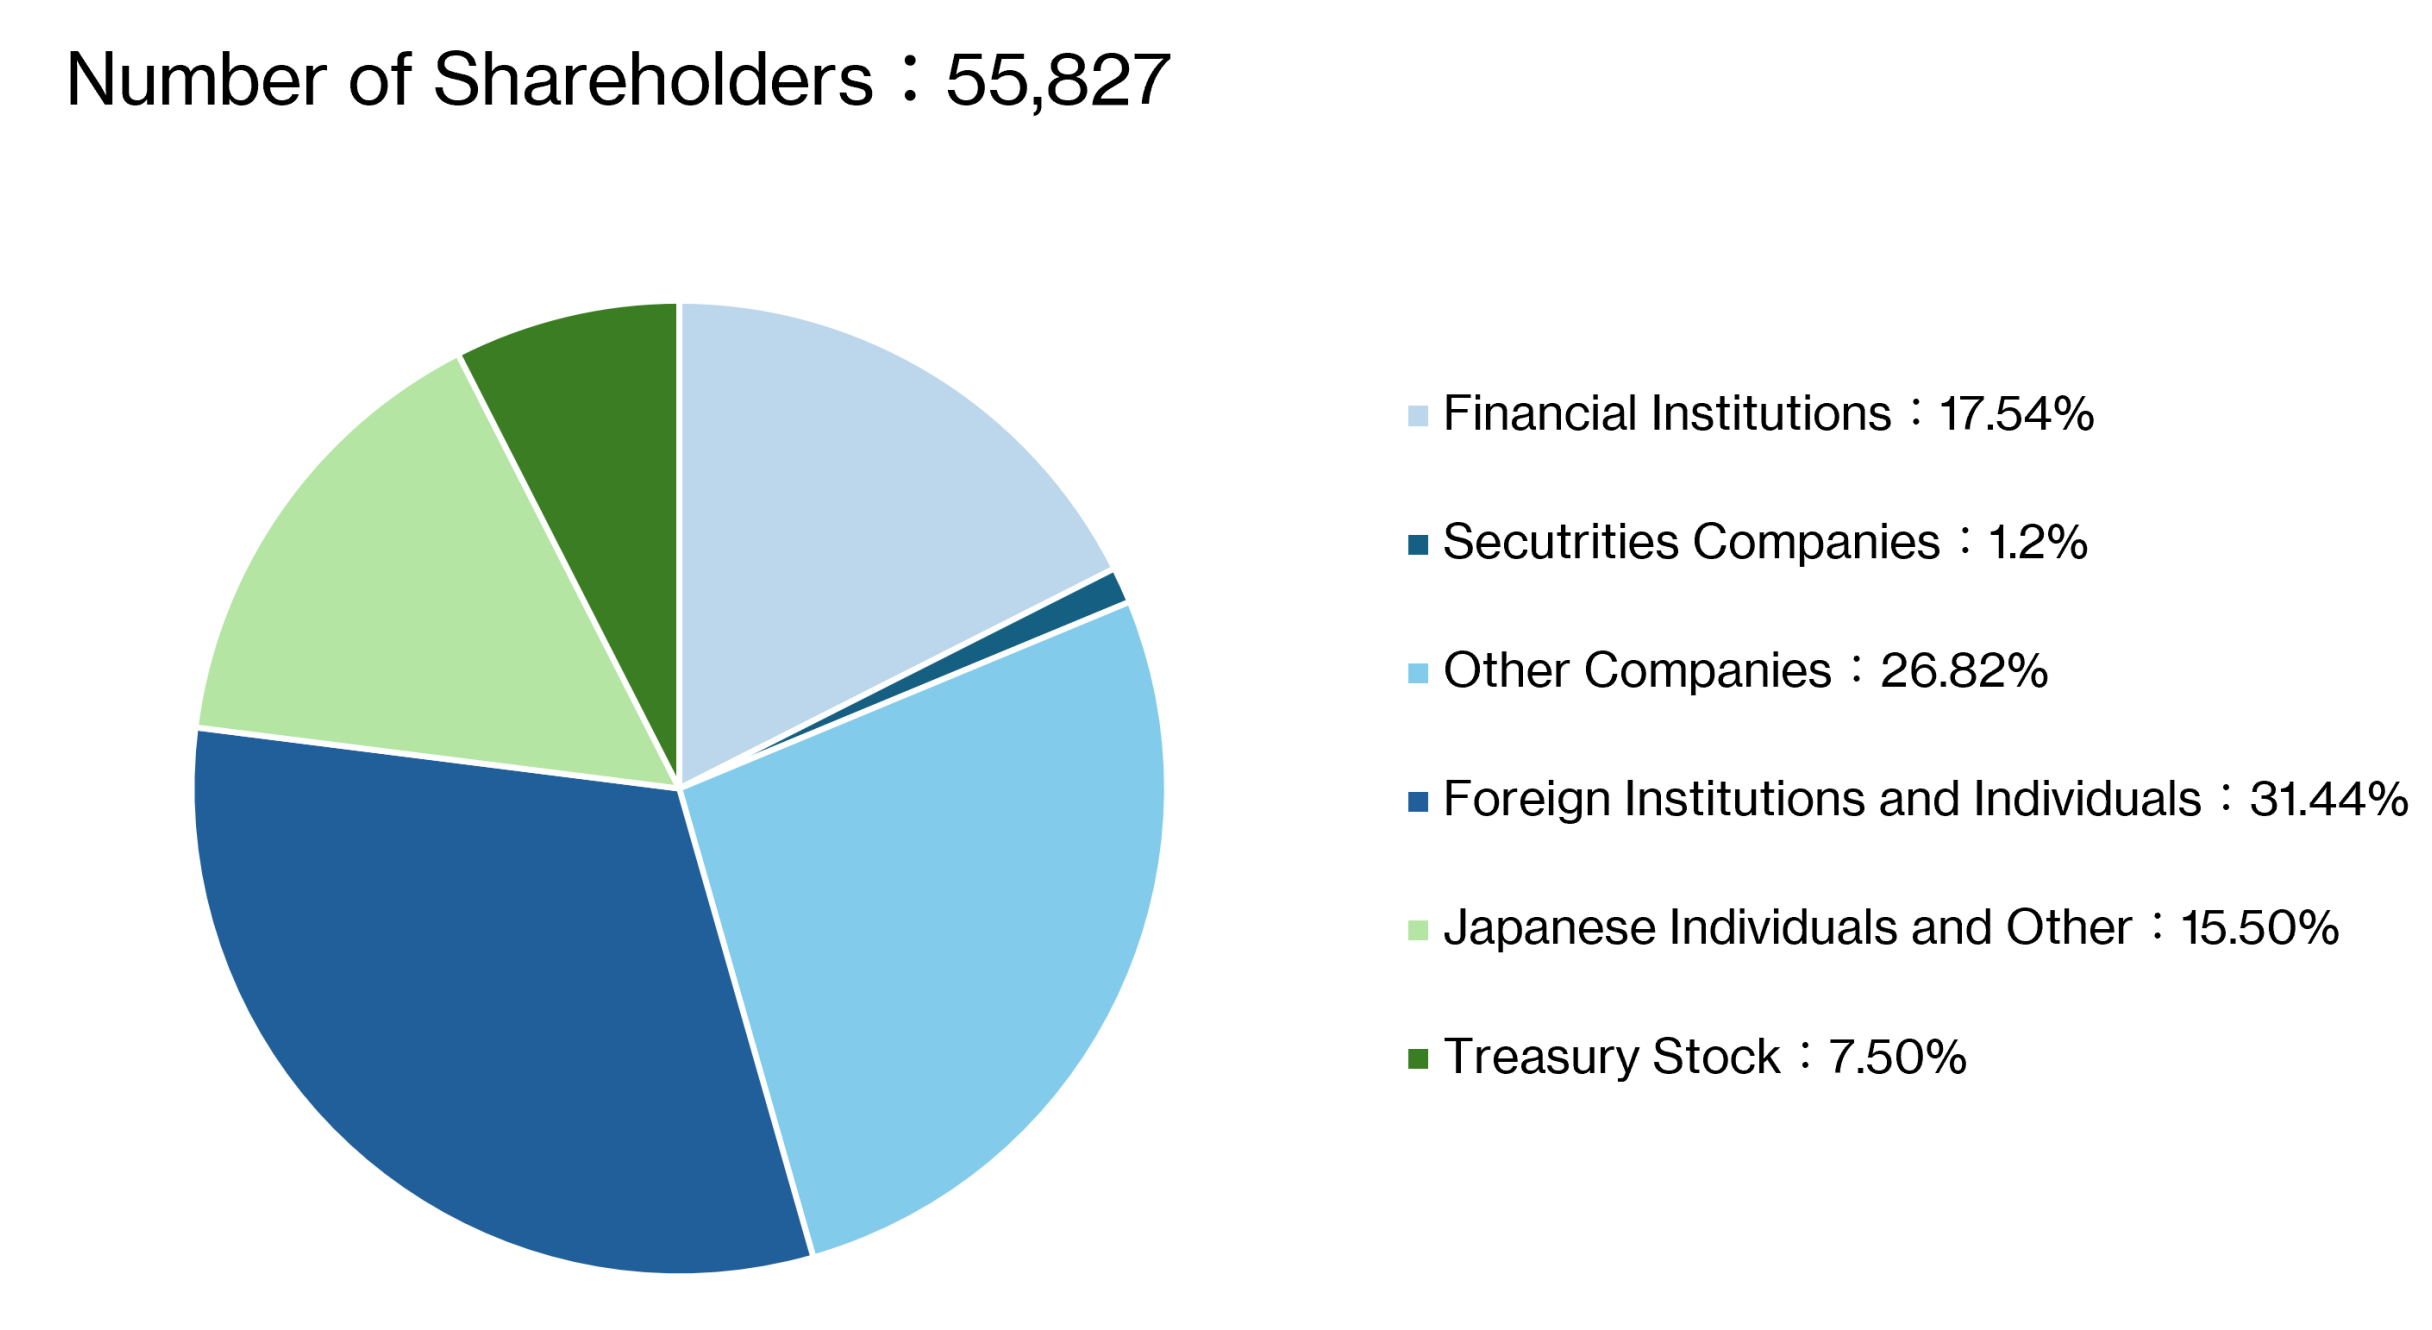
(As of March 31, 2026)
| 2022/ 9/30 |
2023/ 3/31 |
2023/ 9/30 |
2024/ 3/31 |
2024/ 9/30 |
2025/ 3/31 |
2025/ 9/30 |
2026/ 3/31 |
|
|---|---|---|---|---|---|---|---|---|
| Number of Shareholders | 59,757 | 60,659 | 58,435 | 68,796 | 57,799 | 54,328 | 53,108 | 55,827 |
| Financial Institutions (%) | 20.9 | 18.3 | 17.7 | 16.5 | 17.3 | 17.2 | 17.9 | 17.54 |
| Securities Companies (%) | 1.5 | 2.4 | 2.0 | 3.3 | 1.1 | 1.5 | 1.7 | 1.2 |
| Other Companies (%) | 23.0 | 23.1 | 23.0 | 24.3 | 24.0 | 23.7 | 25.9 | 26.82 |
| Foreign Institutions and Individuals (%) |
28.3 | 29.8 | 31.7 | 27.5 | 31.7 | 32.7 | 35.3 | 31.44 |
| Japanese Individuals and Other (%) |
17.8 | 17.9 | 17.1 | 17.9 | 15.1 | 14.3 | 15.2 | 15.50 |
| Treasury Stock (%) | 8.5 | 8.5 | 8.5 | 10.5 | 10.8 | 10.5 | 4.1 | 7.50 |
ADR (American Depository Receipt) Information
Ratio: 4:1
Exchange: OTC(Over the counter)
Symbol: SGAMY
CUSIP: 815794102
BNYMellon Shareowner Services
P.O. Box 43006
Providence, RI 02940
U.S. toll Free : 888-BNY-ADRS (888-269-2377)
International Callers : 201-680-6825
Email: shrrelations@cpushareownerservices.com
Website: https://www.adrbnymellon.com/
Shift in Capital and Outstanding Shares
(As of June 24, 2026)
| Total shares issued and outstanding | Capital | |
|---|---|---|
| FY2005/3 | 140,551,522 | 27,291 |
| FY2006/3 | 283,229,476 | 29,953 |
| FY2007/3 | 283,229,476 | 29,953 |
| FY2008/3 | 283,229,476 | 29,953 |
| FY2009/3 | 283,229,476 | 29,953 |
| FY2010/3 | 283,229,476 | 29,953 |
| FY2011/3 | 283,229,476 | 29,953 |
| FY2012/3 | 266,229,476 | 29,953 |
| FY2013/3 | 266,229,476 | 29,953 |
| FY2014/3 | 266,229,476 | 29,953 |
| FY2015/3 | 266,229,476 | 29,953 |
| FY2016/3 | 266,229,476 | 29,953 |
| FY2017/3 | 266,229,476 | 29,953 |
| FY2018/3 | 266,229,476 | 29,953 |
| FY2019/3 | 266,229,476 | 29,953 |
| FY2020/3 | 266,229,476 | 29,953 |
| FY2021/3 | 266,229,476 | 29,953 |
| FY2022/3 | 266,229,476 | 29,953 |
| FY2023/3 | 241,229,476 | 29,953 |
| FY2024/3 | 241,229,476 | 29,953 |
| FY2025/3 | 241,229,476 | 29,953 |
| FY2026/3 | 221,229,476 | 29,953 |
Stock Splits/Stock Swap Ratio
| Effective Month | Split Ratio | |
|---|---|---|
| TAIYO ELEC Co., Ltd. | 2011/8 | 1:0.4 |
| TMS ENTERTAINMENT, LTD. | 2010/12 | 1:0.26 |
| Sammy Networks Co., Ltd. | 2010/12 | 1:333 |
| SEGA TOYS CO., LTD. | 2010/12 | 1:0.33 |
| SEGA SAMMY HOLDINGS INC. | 2005/11 | 1:2 |
Before business integration in October 2004
Joint holding company “SEGA SAMMY HOLDINGS INC.” was established on October 1, 2004 through the business integration of the two companies and was listed on the first section of the Tokyo Stock Exchange on the same day. SEGA and Sammy currently operate as wholly owned subsidiaries of SEGA SAMMY HOLDINGS.
| Effective Month | Split Ratio | |
|---|---|---|
| Sammy | 2004/2 | 1:1.5 |
| 2001/11 | 1:2 | |
| 2000/11 | 1:2 | |
| SEGA | 1993/5 | 1:1.2 |
| 1992/5 | 1:1.3 | |
| 1991/5 | 1:1.4 | |
| 1990/6 | 1:1.1 | |
| 1989/12 | 1:1.3 | |
| 1989/6 | 1:1.1 | |
| 1988/6 | 1:1.3 | |
| 1987/6 | 1:1.5 |
Status of Large Shareholdings Report Submission
Information on increase/decrease of 1% or more in the Company’s shareholding ratio confirmed based on alteration reports pertaining to the large shareholdings report submitted to the Kanto regional bureau of the Ministry of Finance since 2008
| Date of the Change | Name | Shareholding Ratio after the Change |
Shareholding Ratio before the Change |
|---|---|---|---|
| 2026/6/19 | Wellington Management Company LLP* | 6.35% | 5.33% | 2026/5/15 | Marathon Asset Management Limited | 5.13% | – | 2026/4/30 | Wellington Management Company LLP* | 5.33% | – |
| 2026/4/30 | Nomura Securities Co.,Ltd.* | 5.08% | – |
| 2015/4/6 | BlackRock Japan Co., Ltd.* | 5.07% | – |
| 2015/4/6 | Mitsubishi UFJ Financial Group, Inc.* | 2.88% | 5.37% |
| 2015/3/30 | Mitsubishi UFJ Financial Group, Inc.* | 5.37% | – |
| 2013/3/15 | Mackenzie Financial Corporation* | 4.82% | 6.46% |
| 2011/8/5 | BlackRock Japan Co., Ltd.* | 4.08% | 5.13% |
| 2011/3/28 | Mitsubishi UFJ Financial Group, Inc.* | 2.91% | 8.18% |
| 2011/3/15 | BlackRock Japan Co., Ltd.* | 5.13% | 6.17% |
| 2011/3/14 | Mitsubishi UFJ Financial Group, Inc.* | 8.18% | 6.73% |
| 2011/2/14 | Mitsubishi UFJ Financial Group, Inc.* | 6.73% | 5.34% |
| 2011/1/24 | Mitsubishi UFJ Financial Group, Inc.* | 5.34% | – |
| 2010/11/15 | BlackRock Japan Co., Ltd.* | 6.17% | 5.03% |
| 2010/10/15 | BlackRock Japan Co., Ltd.* | 5.03% | – |
| 2010/10/1 | Tradewinds Global Investors, LLC | 4.42% | 5.83% |
| 2010/8/31 | Fidelity Investments Japan Limited* | 4.50% | 5.76% |
| 2010/2/15 | Fidelity Investments Japan Limited* | 5.76% | 6.91% |
| 2009/1/30 | Fidelity Investments Japan Limited* | 6.91% | 7.25% |
| 2009/1/29 | Tradewinds Global Investors, LLC | 5.83% | 6.86% |
| 2008/12/31 | Mackenzie Cundill Investment Management Ltd.* | 6.42% | 7.50% |
| 2008/10/31 | Mackenzie Cundill Investment Management Ltd.* | 7.50% | 8.83% |
| 2008/9/15 | Fidelity Investments Japan Limited* | 7.25% | 9.74% |
| 2008/8/15 | Fidelity Investments Japan Limited* | 9.74% | 6.40% |
| 2008/8/14 | Tradewinds Global Investors, LLC | 6.86% | 7.93% |
| 2008/8/6 | Mackenzie Cundill Investment Management Ltd.* | 8.83% | 10.07% |
| 2008/7/31 | Fidelity Investments Japan Limited* | 6.40% | – |
| 2008/7/23 | Mackenzie Cundill Investment Management Ltd.* | 10.07% | 11.07% |
| 2008/7/10 | Mackenzie Cundill Investment Management Ltd.* | 11.07% | 11.95% |
| 2008/6/30 | Morgan stanley MUFG Securities Co., Ltd.* | 4.05% | 5.05% |
| 2008/5/7 | Mackenzie Cundill Investment Management Ltd.* | 11.95% | 10.91% |
| 2008/4/30 | Morgan stanley MUFG Securities Co., Ltd.* | 5.05% | 6.17% |
| 2008/3/31 | Capital Research and Management Company | 4.38% | 5.46% |
| 2008/3/14 | Capital Research and Management Company | 5.46% | 7.71% |
| 2008/1/30 | Mackenzie Cundill Investment Management Ltd.* | 10.91% | 9.91% |
| 2008/1/17 | Tradewinds Global Investors, LLC | 7.93% | 6.88% |
In the case of joint ownership, the name of the filer of the Large Shareholding Report or the principal holder is listed.