For Individual Investors
Financial Results Overview / Performance Trends / Return

Financial Results Overview(Quarterly)
FY2027/3
Q1
In the first quarter for the fiscal year ending March 31, 2027, the Group started off with net sales of ¥95,028 million, operating income of ¥2,384 million, and adjusted EBITDA of ¥7,847 million. While the launches of major new titles will be weighted toward the third quarter onward, net sales in each segment were generally in line with expectations, and operating income and adjusted EBITDA exceeded expectations.
| (billion) | FY2026/3 1Q (previous FY) | FY2027/3 1Q (this FY) |
|---|---|---|
| Sales | 81.0 | 95.0 |
| Operating Income | -0.5 | 2.3 |
| Ordinary Income | -2.1 | 3.6 |
| Adjusted EBITDA | 1.4 | 7.8 |
| Profit attributable to owners of parent | -3.3 | 2.1 |
Q2
For the six months ended September 30, 2026, the Group recorded net sales of ¥212,584 million, operating income of ¥14,279 million, and adjusted EBITDA of ¥24,583 million. With launches of major new titles concentrated in the third quarter and beyond, net sales in each segment were generally in line with expectations, while operating income and adjusted EBITDA exceeded expectations. Provisional accounting treatment was applied to the business combination with GAN Limited, completed on May 27, 2025, in the first half of the prior fiscal year. Following the finalization of the accounting treatment at the end of the prior fiscal year, figures for the first half of the prior fiscal year have been retrospectively adjusted for comparison and analysis purposes.
| (billion) | FY2026/3 2Q (previous FY) | FY2027/3 2Q (this FY) |
|---|---|---|
| Sales | 201.1 | 212.5 |
| Operating Income | 10.0 | 14.2 |
| Ordinary Income | 10.8 | 16.1 |
| Adjusted EBITDA | 15.9 | 24.5 |
| Profit attributable to owners of parent | 2.7 | 10.9 |
Financial Results Overview(Full-year)
FY2026/3
In the fiscal year ended March 31, 2026, net sales amounted to ¥487,542 million, operating income was ¥47,128 million, and adjusted EBITDA was ¥16,656 million. While the Pachislot & Pachinko Machines Business performed strongly, operating income decreased compared to the prior fiscal year, mainly due to the sluggish performance of the Entertainment Contents Business, as well as the impact of the consolidation of the financial results of GAN Limited and Stakelogic B.V. (“Stakelogic”), both of which were acquired in the Gaming Business.
In addition, as impairment losses on goodwill and other intangible assets related to Rovio Entertainment Ltd (“Rovio”), as well as on goodwill and property, plant and equipment related to Stakelogic, were recognized as extraordinary losses, net loss attributable to owners of parent amounted to ¥5,756 million. Furthermore, a gain on deferred tax adjustments was recorded following a review of the recoverability of deferred tax assets.
| (billion) | FY2025/3 (previous FY) | FY2026/3 (this FY) |
|---|---|---|
| Sales | 428.9 | 487.5 |
| Operating Income | 48.1 | 47.1 |
| Ordinary Income | 53.1 | 54.2 |
| Adjusted EBITDA | 62.2 | 16.6 |
| Profit attributable to owners of parent | 45.0 | -5.7 |
Performance Trends
SEGA SAMMY Group Operating Results


- Net Sales (left)
- Ordinary income (right)
- Net Sales (left)
- Ordinary income (right)
For those who would like to know more details
Return
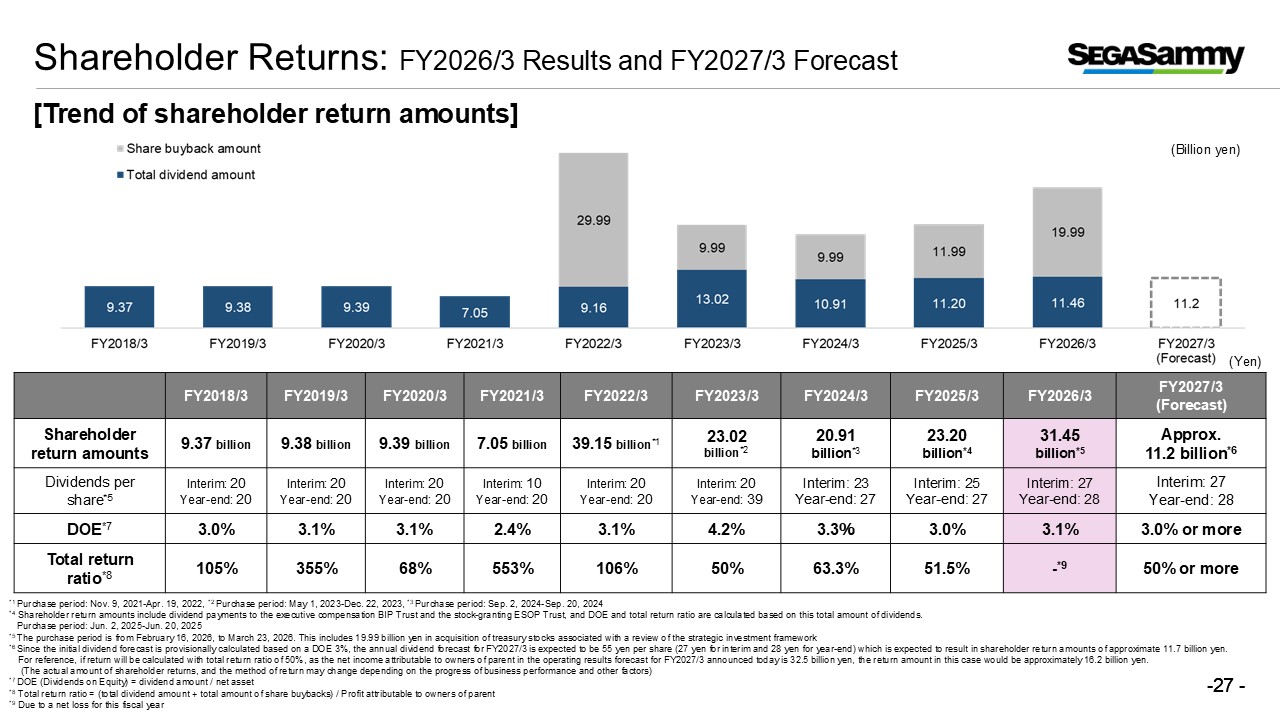
By investing in SEGA SAMMY Holdings as a shareholder, you can receive a portion of the company profits as dividends.
Basic Policy on Profit Distribution Including Dividends
The Company positions the return of profits to shareholders as an important management issue.
We aim to maximize corporate value through the management focusing on capital efficiency in its medium-term financial strategy until the fiscal year ending March 2026 and while promoting aggressive investment for growth, we will also provide appropriate shareholder returns. The basic policy for shareholder returns is to apply DOE (Dividend on equity ratio) 3% or more, or the total return ratio of 50% or more, whichever is higher and implement shareholder returns through dividends or share buybacks.